This is one of the most common questions Lagos Data School gets from students who are just starting. Should I learn Python or Excel for forecasting? Which one will help me get a job faster? Which one will serve me better in the long run?
The honest answer is not as simple as picking a winner. Both tools have real strengths. Both have real limits. And the right choice depends on where you are now, what kind of work you want to do, and what Nigerian employers in your target sector actually use.
This guide walks through the comparison clearly and honestly, so you can make the right choice for your own situation rather than following general advice that may not fit the Nigerian market you are stepping into.
Lagos Data School created this guide as part of our data analytics career-help work. We train Nigerian analysts every day, and we see firsthand which tool choices lead to good outcomes and which ones slow people down.
What Is Time Series Forecasting?
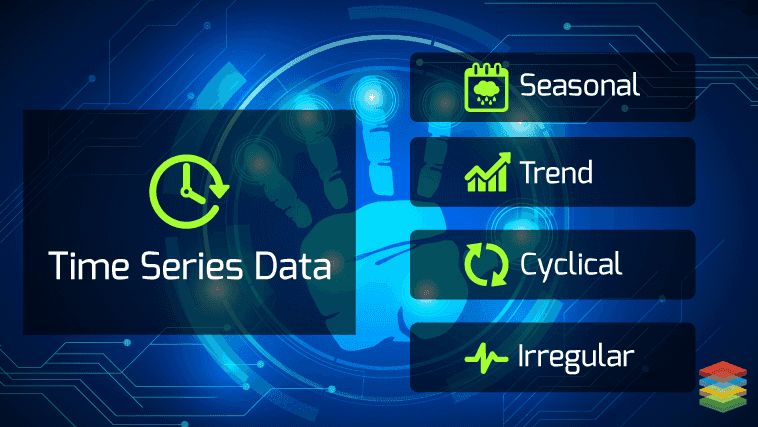
Before comparing the tools, let us quickly ground ourselves in what time series forecasting actually means. A time series is any dataset where values are recorded at regular intervals over time. Monthly sales figures. Daily website visits. Weekly stock levels. All of these are time series.

Time series forecasting is the act of using that historical data to predict future values. If you know how your sales have moved over the past twelve months, forecasting helps you estimate what the next three months might look like.
This skill is used across banking, retail, telecoms, logistics, and government work in Nigeria. Any business that wants to plan rather than react after the fact needs someone who can do this work.
What Excel Can Do for Time Series Forecasting
Excel has been the tool of choice for Nigerian business analysts for decades. It is installed on almost every office computer in the country. Most hiring managers understand it. Most decision makers trust a report that comes out of it.
For time series forecasting work, Excel gives you a few built-in tools.
Trendlines on Charts
You can add a trendline to any Excel line chart with just a few clicks. This draws a straight or curved line through your historical data and can extend it forward to show where the trend is heading. It is not a full forecasting model, but it provides a useful visual signal quickly, with no formula writing required.
Moving Average
Excel’s Data Analysis Toolpak includes a moving average tool. You select your data range, choose how many periods to average, and Excel generates the smoothed output and a chart in seconds. This is genuinely useful for business reporting and for showing management a simple, clean trend.
FORECAST Function Family
Excel has a FORECAST.ETS function that applies exponential smoothing to time series data. It handles some seasonality automatically and returns a point forecast for any future period you specify. For a Nigerian SME owner or a business analyst who needs a quick forecast without writing code, this function is a practical, accessible option.
Manual Calculation of Seasonal Indices
A skilled Excel user can build a fairly detailed seasonal forecast right inside a spreadsheet. It takes more effort than Python, but any manager can open the file and see the work directly.
What Excel Cannot Do Well
Excel’s forecasting capabilities are real, but they have clear limits that matter increasingly as your data grows or your needs become more specific.
- Excel slows down a lot with large datasets, often any file over 50,000 rows
- It has no built-in ARIMA model, which is one of the most widely used statistical forecasting methods
- Seasonal adjustments in Excel are manual and error-prone at scale
- It is hard to repeat an Excel forecast because the steps sit inside the file, not in a separate, clear record
- Excel models are hard to automate or schedule, meaning someone must manually update them each period
- Working together on a complex Excel forecast model is messy and often leads to version mix-ups
What Python Can Do for Time Series Forecasting
Python is the leading language for data science and machine learning across the world. It is fast becoming the standard in Nigerian banking, fintech, and larger firm data teams. For time series forecasting, it gives you tools that go well past what Excel can do.
pandas
The pandas library lets you load, clean, and manipulate time series data with a few lines of code. It handles date parsing, resampling between different time periods, and missing value treatment automatically. Working with a million rows of daily sales data is no harder than working with a hundred.
statsmodels
The statsmodels library has a full ARIMA tool, seasonal breakdown features, and data stability tests. This gives you the rigour that serious forecasting needs, most of all in banking and finance.
Prophet
Prophet, built by Meta, handles seasonal patterns, public holidays, and trend shifts on its own. You can model Nigerian public holidays directly and get a clear, visual forecast in very few lines of code. Lagos Data School teaches Prophet as a core tool because it gives good results fast, even for analysts still building their stats knowledge.
scikit-learn
For machine learning approaches to forecasting, scikit-learn gives you many regression model types that can be set up for time series work. This opens the door to more complex, richer models that go beyond what basic statistical methods can do.
Automation and Scheduling
Python forecasting scripts can run on a schedule on their own, pulling fresh data, making new forecasts, and sending results to a dashboard or report with no human step needed. This is not possible in Excel at any real scale.
What Python Cannot Do As Easily?
Python is not without its own limits, and being honest about these helps you set realistic expectations.
- Python has a learning curve that is steeper than Excel. This is most true for those with no prior coding background
- Sharing results requires extra steps, since not everyone can run a Python script
- Setup and environment management can be confusing for beginners
- Simple, one-off forecasts are faster to do in Excel than to write from scratch in Python
- Turning Python output into a clear story for a non-technical manager takes real extra effort
A Direct Comparison
| Factor | Excel | Python |
| Ease of learning | Easier for beginners | Steeper at first |
| Speed for simple tasks | Faster for quick jobs | More setup needed |
| Handling big data | Slows down fast | Handles large files well |
| ARIMA and stat models | Not built-in | Full support |
| Automation | Very limited | Strong automation |
| Nigerian job market | Expected at most firms | Growing fast in banks and fintechs |
| Long-term career value | Good for analysts | Very high for data professionals |
Which One Should Nigerian Analysts Learn First?
Lagos Data School’s honest recommendation is this: if you already know Excel reasonably well, start Python. If you do not yet know Excel, build a solid Excel base first, then move to Python.
Here is the reasoning behind this. Excel is a prerequisite for most Nigerian office jobs right now, not just data jobs. If you cannot use Excel confidently, you will struggle in many roles even before you get to do any forecasting work. Master it first if you have not already.
Once Excel is in place, Python is the natural and important next step. Python opens doors that Excel cannot, especially in Nigerian banks, fintechs, and larger firms that are building serious data teams. The salary difference between an Excel analyst and a Python-using data analyst in Nigeria is real and significant.
How to Build Both Skills Efficiently
The good news is that you do not have to choose one and ignore the other forever. Many Nigerian data professionals use both, picking the right tool for each specific task.
Use Excel when you need a quick, explainable answer for a non-technical manager. Use Python when you are building a serious model that will run regularly, handle large data, or need a level of accuracy that Excel cannot reach.
A Practical Learning Path
Weeks 1 to 4: Excel fundamentals, data cleaning, pivot tables, and the FORECAST.ETS function.
5 to 8: Introduction to Python, pandas, and plotting with matplotlib.
9 to 12: Time series basics in Python, moving averages, and your first Prophet forecast.
13 to 16: ARIMA in statsmodels, model evaluation, and building a full forecasting pipeline.
This sixteen-week path takes a complete beginner from no data skills to a working forecasting skill in both tools. Lagos Data School structures it into a guided, hands-on course.
What Nigerian Employers Actually Expect
Lagos Data School talks with Nigerian employers regularly to understand what they truly want from data analyst candidates. Here is what they consistently say.
At the entry level, most Nigerian employers expect strong Excel. This is the minimum table stake for almost any analyst role. Weak Excel skills are a red flag for most hiring managers, even those who use Python themselves.
At the mid level, Python is increasingly listed as a requirement rather than a nice-to-have. Nigerian banks and fintechs have been building Python-based data pipelines for several years now. Staff who can maintain and extend these pipelines are in genuine, growing demand.
At the senior level, employers expect both tools, plus the ability to explain results clearly to business leaders who use neither. This mix of deep tech skill and clear communication is the most valued profile in the Nigerian data job market right now.
Real Nigerian Analyst Profiles
To make this concrete, here are three real-world profiles that Lagos Data School sees among our graduates and hiring network.
Profile 1: The Excel-Strong Business Analyst
This person works at a mid-size Nigerian company. They produce monthly reports, track KPIs, and use FORECAST.ETS to project next month’s revenue for management presentations. Excel is their primary tool. They may add basic Python skills over time but are productive and valued right now. Salary range is above average for general office work.
Profile 2: The Junior Data Analyst With Python
This person works at a Nigerian fintech or a bank’s data team. They write Python scripts that pull data from a database, run a monthly forecast using Prophet, and output results to a shared dashboard. They use Excel for quick checks and ad hoc tasks but live primarily in Python. Salary is noticeably higher than the Excel analyst.
Profile 3: The Forecasting Specialist
This person works at a large Nigerian bank or a consulting firm. They build, maintain, and improve a suite of forecasting models that feed business decisions across multiple departments. They are comfortable with both Excel and Python, can explain statistical methods to non-technical audiences, and are seen as a key, hard-to-replace member of their team. Salary is among the highest in the Nigerian data field.
Lagos Data School trains students to progress along this path, starting at Profile 1 and building steadily toward Profile 3 over two to three years of genuine, focused skill development.
Common Misconceptions to Clear Up
Misconception 1: Python Will Replace Excel
Python has not replaced Excel in Nigerian offices and is unlikely to do so in the near term. Too many business processes, reports, and communication formats are built around spreadsheets. Excel and Python coexist in most serious data teams, each handling the tasks it does best.
Misconception 2: You Need a Programming Background to Learn Python
You do not. Many Lagos Data School students with no prior coding experience have learned Python to a job-ready level within three to four months of focused, structured study. The learning curve is real, but it is manageable with the right guidance.
Misconception 3: Excel Is Only for Non-Technical People
Excel mastery is a real, valuable skill even for strong tech professionals. Being able to produce a clean, well-laid-out Excel model that a business leader can read and trust is something many Python users cannot do well. Nigerian employers value this skill at every level.
Practice Exercises for Both Tools
Lagos Data School suggests the exercises below to help Nigerian analysts build real skill in both tools, not just theory.
Excel Exercises
- Download three years of monthly sales data and build a moving average forecast for the next six months
- Use FORECAST.ETS to project quarterly revenue and compare it to the moving average output
- Work out seasonal index values by hand for a dataset with a clear yearly cycle
- Build a simple dashboard with charts showing historical data alongside the forecast
Python Exercises
- Load a CSV of daily sales data with pandas and plot it as a line chart with matplotlib
- Build a Prophet forecast for the same dataset and compare it to the Excel output
- Run an ADF stationarity test using statsmodels and apply differencing if needed
- Build a simple ARIMA model and evaluate it using MAE against a held-out test period
What Lagos Data School Students Say About This Choice
Lagos Data School has run this exact debate in our classrooms many times. Here is what actually happens when we ask Nigerian students to share their honest take after learning both tools.
Almost every student who started with Excel and then moved to Python says the same thing. Excel made me feel safe. Python made me feel powerful. The truth is that you need both of those feelings at different points in your career.
The students who tried to skip Excel and go straight to Python often hit a wall when they had to share their work with a manager or a client. They could build the model. They could not produce a clean, readable output that a non-technical person could open and trust right away.
The students who learned Excel first and then moved to Python found the transition much smoother than they expected. Many of the ideas carry over. The way you think about rows and columns, about aggregating data, about spotting errors, these all transfer naturally from Excel to Python.
So the debate between the two tools is real, but it is not as sharp as it first appears. They work together more than they compete. Lagos Data School teaches both, in order, because that is what leads to the best real-world outcomes for Nigerian analysts.
A Practical Example: The Same Forecast in Two Tools
Let us make this very concrete. Imagine a Lagos bakery that wants to forecast next month’s bread roll sales.
In Excel, the owner opens her sales spreadsheet, selects the last twelve months of daily sales, adds a trendline to the chart, and reads off the projected value for next month. It takes ten minutes. She can print it and show it to anyone. Done.
In Python, a data analyst loads the same data into pandas, runs a Prophet forecast, and gets back a prediction with a confidence range shown as a shaded band on a clear chart. The model accounts for the bakery’s known weekly patterns and the Christmas peak automatically. It takes thirty minutes to set up the first time but runs in two minutes every month after that.
Which is better? That depends on the question. For the owner doing this herself for one product, Excel is fine and fast. For an analyst maintaining monthly forecasts across 200 products for six branches, Python is the only realistic option.
The tool should fit the task. That is the simple rule. And knowing both tools means you can always choose the right one rather than being limited to just one way of working.
What Matters More Than the Tool
Here is something Lagos Data School believes deeply. The tool you use matters far less than how clearly you can think about the problem in front of you.
The best analysts we know are not the best because they know Python better than anyone else. They are the best because they ask better questions, know what the business needs before they open a single tool, know which part of the data tells the real story, and they know how to say it clearly once they have found it.
A bad analyst with Python will produce a confusing, unusable output. A good analyst with Excel will produce a clear, useful, and trusted result. The tool does not make the analyst. The analyst makes the tool useful.
So yes, learn Python. Yes, learn Excel. But most of all, learn to think clearly about data problems. Learn to ask a sharp question. Learn to look at data and know what matters and what does not. That skill is what separates the best Nigerian data professionals from the rest. And it is something Lagos Data School trains into every student, alongside the technical tools, from day one.
The Short Version of Everything in This Guide
If you have skimmed this guide and want the plain short version, here it is.
Start with Excel if you do not know it yet. Excel is the base. You need it for almost any Nigerian data job. It is fast for simple tasks. It is easy to share. Every manager can read it.
Add Python once Excel is solid. Python is more powerful. It handles more data, does more things, and opens doors Excel cannot open, most of all in banks, fintechs, and larger firms.
Use both together. They are not rivals. They are partners. Let Excel be your fast, simple tool for quick tasks. Let Python be your serious tool for complex models and automated work.
Get good at both. Then focus on being someone who thinks well about business data problems. That is the real skill. Lagos Data School trains you to build all of this, step by step.
Pick one. Start today. One hour. That is all it takes to begin.
Do not overthink it. Just start.
Recommended External Resource
For free, hands-on Python data science exercises, visit Kaggle Learn’s Python and data science courses: https://www.kaggle.com/learn.
A Tool Choice Self-Check
Before deciding which tool to focus on next, run through this short check.
- Are you already confident with Excel for data work, pivot tables, and charts?
- Do Nigerian job ads in your target sector mention Python as a requirement or preference?
- Are you targeting a role that involves large datasets or automated reporting pipelines?
- Do you have three to four months to invest in structured Python learning?
If you said yes to questions one and two and no to three and four, Excel is your focus for now. If you said yes to all four, Python is your clear next step. Either way, Lagos Data School has a clear path to help you build the skill you need next. It is built for the Nigerian market. It works.
About Lagos Data School
Lagos Data School is Nigeria’s top school for cybersecurity, data science, cloud, and analytics. Every idea in this guide is part of our hands-on course.
Our teachers are real security pros, not just classroom staff. So you learn from people who guard live networks every day.
We run classes on weekdays, weekends, and online. So no matter your time, we have a slot for you. Beyond skills, we also give you a real certificate and links to job partners.
Visit Lagos Data School today to view our courses and join the next class.
Learn the right tool first. Train with Lagos Data School.