

Tableau Training in Ikeja Lagos Nigeria
Why Tableau is the Best Visualization Tool
Data analysis and data visualization are vital in today’s extremely competitive
business climate. But doing great analysis and creating useful visualizations can feel difficult, complex, and not for the faint of heart.
Fortunately, a solution is available that makes the whole process much easier and will have you analyzing and visualizing data like a pro in no time. Tableau Desktop is a tool that was designed to enable you to perform complex data analysis tasks and create powerful, interactive visualizations that communicate the analysis. In addition, Tableau allows you to share your analysis and visualizations across your organization, so everyone from coworkers to top management can dig into the data that matters to them. This truly is a tool that provides you with a huge competitive advantage.
The Emergence of Tableau for Data Visualization
In the past, most people got along with using tools like Microsoft Excel to analyze business data. Although there’s no getting around the fact that Excel is both popular and useful, Tableau provides a significant boost in power and ease-of-use when it comes to in-depth data analysis, data visualization, and communicating with data. Quite simply, you need a tool like Tableau Desktop to do the job right.
Importing Files into Tableau
Tableau works with all kinds of source data that can be located almost anywhere as long as it’s accessible to the user. That source could be an Excel file, a text file, or a database. To do anything in Tableau, then, you first have to specify your data source or sources.
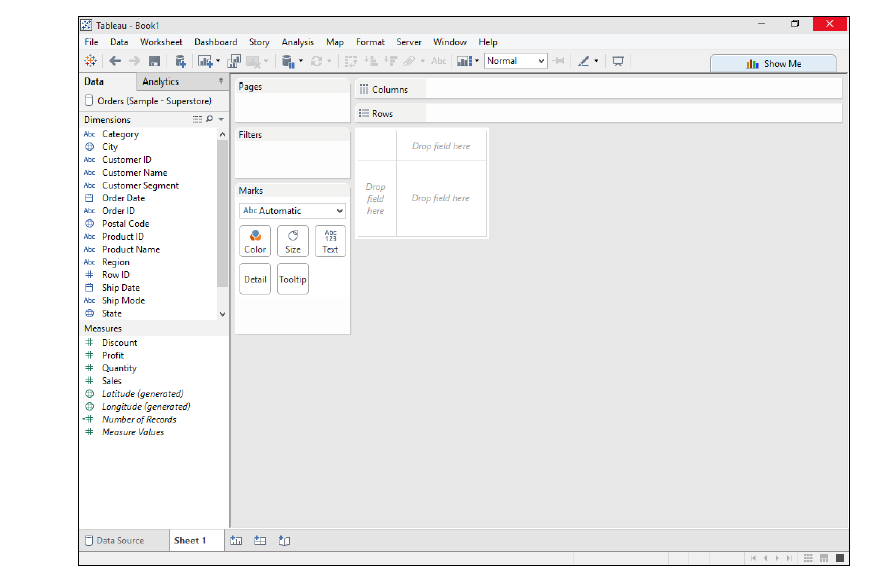
Visualizing Data with Tableau
People have a hard time getting much useful information from raw data until they perform some sort of data analysis on the numbers. In the past, it was fairly common to simply do some magic and produce numbers that summarized the data and call the job complete. Today, executives expect their staff to go well beyond simply producing reports that summarize data numerically. People want insightful graphical representations that make it easier to understand the results of the data analysis and this can be best done with the mix of worksheets, dashboards and stories in Tableau.
Telling Stories with Tableau
Sometimes you’ll want to share a specific insight with your audience, and you’ll want to help the audience understand the process that you went through to get there. Tableau makes it possible for you to do so using stories.
A story is a special type of Tableau sheet that contains worksheets o
r dashboards connected in sequence as story points.
When you create a story in Tableau, you add the worksheets and dashboards in the sequence that you want them to appear in the story. The story points appear as blocks of text above the worksheets and dashboards. You can use them to explain your analysis to viewers, who can click to find out what’s next.
Effectively, using Tableau Story Points allows you to provide an interactive narrative to your visualizations so people can follow your path to insight.
Enroll for your Tableau Training in Lagos Nigeria at Lagos Data School