Data analysts in Lagos deal with time-based data every single day. Monthly sales figures. Daily website visits. Weekly stock levels. All of these are what we call time series data, and knowing how to forecast from them is one of the most valuable skills a data analyst can build.
This guide explains time series forecasting in plain, clear terms. It covers the key ideas, the main techniques, and the top tools that Lagos-based data analysts use in real work settings.
Lagos Data School made this guide as part of our data analytics course. We build this skill directly into our training because it comes up again and again in real Nigerian data roles.
What Is Time Series Data?
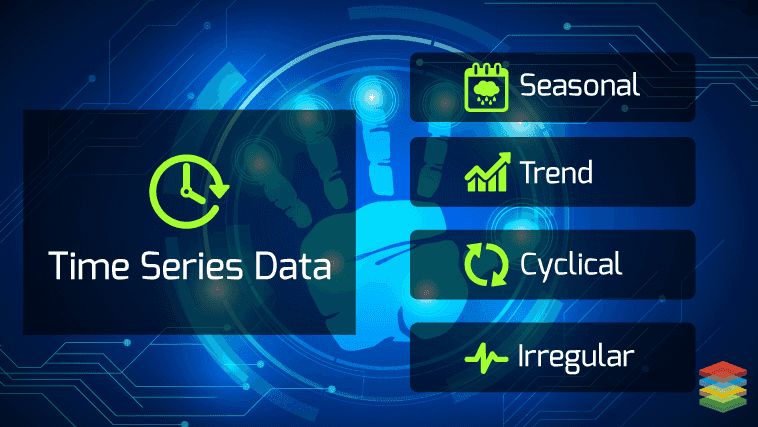
Time series data is any set of values recorded at regular points in time. The time gap between each point must be the same. This could be every hour, every day, every week, or every month.

Here are a few clear examples from the Nigerian business world.
- A bank’s daily transaction count over the past two years
- A telecoms firm’s monthly active user count over 36 months
- A supermarket’s weekly revenue figures for the past year
- A generator fuel reseller’s daily sales volume across 12 months
All of these share one feature: each data point is linked to a specific point in time, and the order of those points matters a great deal.
What Is Time Series Forecasting?
Time series forecasting is the process of using past, time-stamped data to make predictions about future values. If you know how a business’s sales have behaved over the past two years, a forecasting model can use that pattern to estimate what sales might look like over the next three months.
This is not guessing. It is pattern recognition. The model finds real, repeating patterns in the historical data and uses those patterns to project forward with a measured level of confidence.
Key Concepts Every Lagos Analyst Should Know
Before you start building forecasting models, a few core ideas are worth understanding clearly.
Trend
A trend is a long-term direction in the data. Sales that rise consistently month after month have an upward trend. A telecom firm losing subscribers over time has a downward trend. Identifying the trend is the first step in any forecast.
Seasonality
Seasonality refers to patterns that repeat at regular intervals. Nigerian retail businesses often see higher sales in December due to the festive season. A fuel reseller may see a weekly peak every Friday. These repeating cycles are called seasonal patterns.
Noise
Noise is random variation in the data that has no clear pattern or cause. Every real dataset contains some noise. Good forecasting models learn to separate meaningful patterns from this background noise.
Stationarity
A time series is said to be stationary when its average value and its spread do not change over time. Many forecasting models work best on stationary data. If your data is not stationary, you apply a technique called differencing to make it so before running your model.
Main Techniques Used in Time Series Forecasting
There are several techniques data analysts in Lagos use for forecasting work. Here are the most important ones, explained in plain terms.
Moving Average
This is the simplest technique. You take the average of the last few data points to predict the next one. If weekly sales for the past four weeks were 100, 110, 90, and 120, the moving average forecast for next week would be 105.
It is easy to calculate and easy to explain to a business manager. But it works best only when data has no strong trend or seasonal pattern.
Exponential Smoothing
Exponential smoothing is like a moving average, but it gives more weight to recent data and less weight to older data. This makes it more responsive to changes in the trend. It is very widely used in Nigerian retail and logistics forecasting.
ARIMA
ARIMA stands for AutoRegressive Integrated Moving Average. It is one of the most widely used statistical forecasting methods in the world. It works well on stationary data and can handle both trend and noise. Lagos data analysts who want to move beyond basic methods often learn ARIMA next.
Prophet
Prophet is a free forecasting tool built by Meta (the company behind Facebook). It was designed to be easy to use even without deep statistics knowledge. It handles seasonal patterns and missing data well, and it works directly in Python or R. Many Nigerian data analysts now use Prophet as their go-to forecasting tool.
LSTM (Long Short-Term Memory)
LSTM is a type of deep learning model that can capture very complex patterns in time series data. It needs more data and more computing power than the other methods, but it can handle patterns that simpler models miss. It is best suited for analysts who already have a solid base in machine learning.
Comparison of Forecasting Methods
| Method | Best For | Skill Level Needed |
| Moving Average | Simple, stable data | Beginner |
| Exponential Smoothing | Data with mild trends | Beginner to mid |
| ARIMA | Stationary data with noise | Mid level |
| Prophet | Data with strong seasonality | Mid level |
| LSTM | Complex, large datasets | Advanced |
Tools Lagos Data Analysts Use for Forecasting
Knowing the techniques is only half the work. You also need to know which tools to use in practice.
Python
Python is the most popular language for forecasting in Nigeria and across the world. Its data tools let you build strong models with less code than you might expect. Lagos Data School teaches Python as the main forecasting tool in our course.
R
R is another strong option, especially for analysts coming from a statistics background. Packages like forecast and tseries are well suited for ARIMA and related methods. Some Nigerian financial institutions use R specifically for their forecasting work.
Excel
For analysts who are not yet ready to code, Excel offers a simple trendline and moving average feature built right into its chart tools. It will not match the power of Python or R, but it is a genuine starting point for beginners.
Power BI and Tableau
Both Power BI and Tableau include some built-in forecasting features that require no coding at all. These are useful for business analysts who need to produce forecast visuals quickly for presentations and reports without writing a single line of code.
A Practical Forecasting Workflow for Lagos Analysts
Here is the step-by-step workflow that Lagos Data School teaches for a real forecasting project.
Step 1: Load and Explore Your Data
Import your time series data into Python or Excel. Plot it as a line chart. Look for obvious trends, seasonal peaks, or sudden drops. This first visual check tells you a great deal about what techniques may work best.
Step 2: Check for Stationarity
Run a simple statistical test such as the Augmented Dickey-Fuller test in Python to check if your data is stationary. If it is not, apply differencing until it becomes so.
Step 3: Choose and Fit Your Model
Based on your data’s characteristics, choose the right technique. Start simple. A basic ARIMA or exponential smoothing model is the right first step for most Lagos analysts working on business forecasting.
Step 4: Evaluate Your Forecast
Compare your model’s predictions against actual past values it did not train on. Use error metrics such as Mean Absolute Error (MAE) or Root Mean Squared Error (RMSE) to measure how accurate the model truly is.
Step 5: Present the Results Clearly
A good forecast is only useful if the people making decisions can understand it. Plot your forecast on a clear chart with confidence intervals shown. Use plain language to explain what the numbers mean for the business.
Common Mistakes Lagos Data Analysts Make With Forecasting
Lagos Data School sees these errors come up often in student work and in real-world projects.
- Trying to forecast too far ahead when you do not have enough past data to back it up
- Ignoring a clear seasonal pattern that the data shows again and again
- Picking a complex model like LSTM before trying simpler methods first
- Not keeping a test set aside before you train your model on the full data
- Showing one forecast number with no range of likely values around it
Why Every Lagos Analyst Should Know at Least One Forecasting Method
You do not need to master all five methods on this list to add real value as an analyst. But knowing at least one well opens many doors that a general data role alone would not.
Think about it from a hiring manager’s point of view. Two candidates apply for the same data role. Both can clean data. Both can build a chart. But one can also say: I have built a sales forecast for a real business and it was accurate to within 8%.
That one extra thing makes a real, clear difference. It shows the manager that this analyst can do work that directly helps the firm plan better, spend smarter, and grow faster.
This is why Lagos Data School teaches forecasting as a core part of our data analytics course, not as an extra topic saved for advanced learners. Every analyst in Nigeria who wants to be truly useful to a real business should be able to build at least a basic, working forecast from their own data.
Time series forecasting is a core skill in banking, telecoms, retail, logistics, and government work across Nigeria. Analysts who can build and explain good forecasts are in real demand. They also earn above-average pay compared to general data roles.
Lagos Data School graduates who focus on forecasting often report strong job offers from Nigerian banks, fintech firms, and supply chain firms. These employers need this skill applied to real Nigerian data.
Plain Advice for Lagos Data Analysts Starting Out
If all the method names and tool names above feel like a lot at once, here is the honest advice Lagos Data School gives to every new analyst who walks through our door.
Start with one method. Not five. Just one.
Pick moving average. Learn it well. Use it on one real dataset from a business you know. See what it tells you. Then move on to the next method only when you feel truly at ease with the first.
This slow, steady approach might feel less exciting than trying to learn ARIMA and LSTM at the same time. But it leads to real, lasting skill. And real, lasting skill is what Nigerian employers actually pay for.
Lagos Data School trains analysts this way every year. The ones who go slow and stay steady at the start are always the ones who go furthest in the end.
So pick one. Learn it well. Then move on. That is the whole plan.
Recommended External Resource
For free, hands-on time series tutorials using Python, visit the Towards Data Science forecasting guide on Medium: https://towardsdatascience.com/time-series-forecasting-with-python-8d7d1f7d6b8c
A Forecasting Readiness Self-Check
Run through this short check to see where you stand as a Lagos data analyst.
- Can you identify a trend and a seasonal pattern in a data chart?
- Do you know how to import and plot time series data in Python or Excel?
- Have you heard of ARIMA or Prophet and understand roughly what they do?
- Can you explain what MAE or RMSE means when someone asks you about model accuracy?
If you said yes to all four, you have a solid enough base to start building real forecasting models now. If you said no to any of them, Lagos Data School’s data analytics course covers each of these points in a clear, practical way built for Nigerian analysts.
About Lagos Data School
Lagos Data School is Nigeria’s top school for cybersecurity, data science, cloud, and analytics. Every idea in this guide is part of our hands-on course.
Our teachers are real security pros, not just classroom staff. So you learn from people who guard live networks every day.
We run classes on weekdays, weekends, and online. So no matter your time, we have a slot for you. Beyond skills, we also give you a real certificate and links to job partners.
Visit Lagos Data School today to view our courses and join the next class.
Forecast with confidence. Train with Lagos Data School.